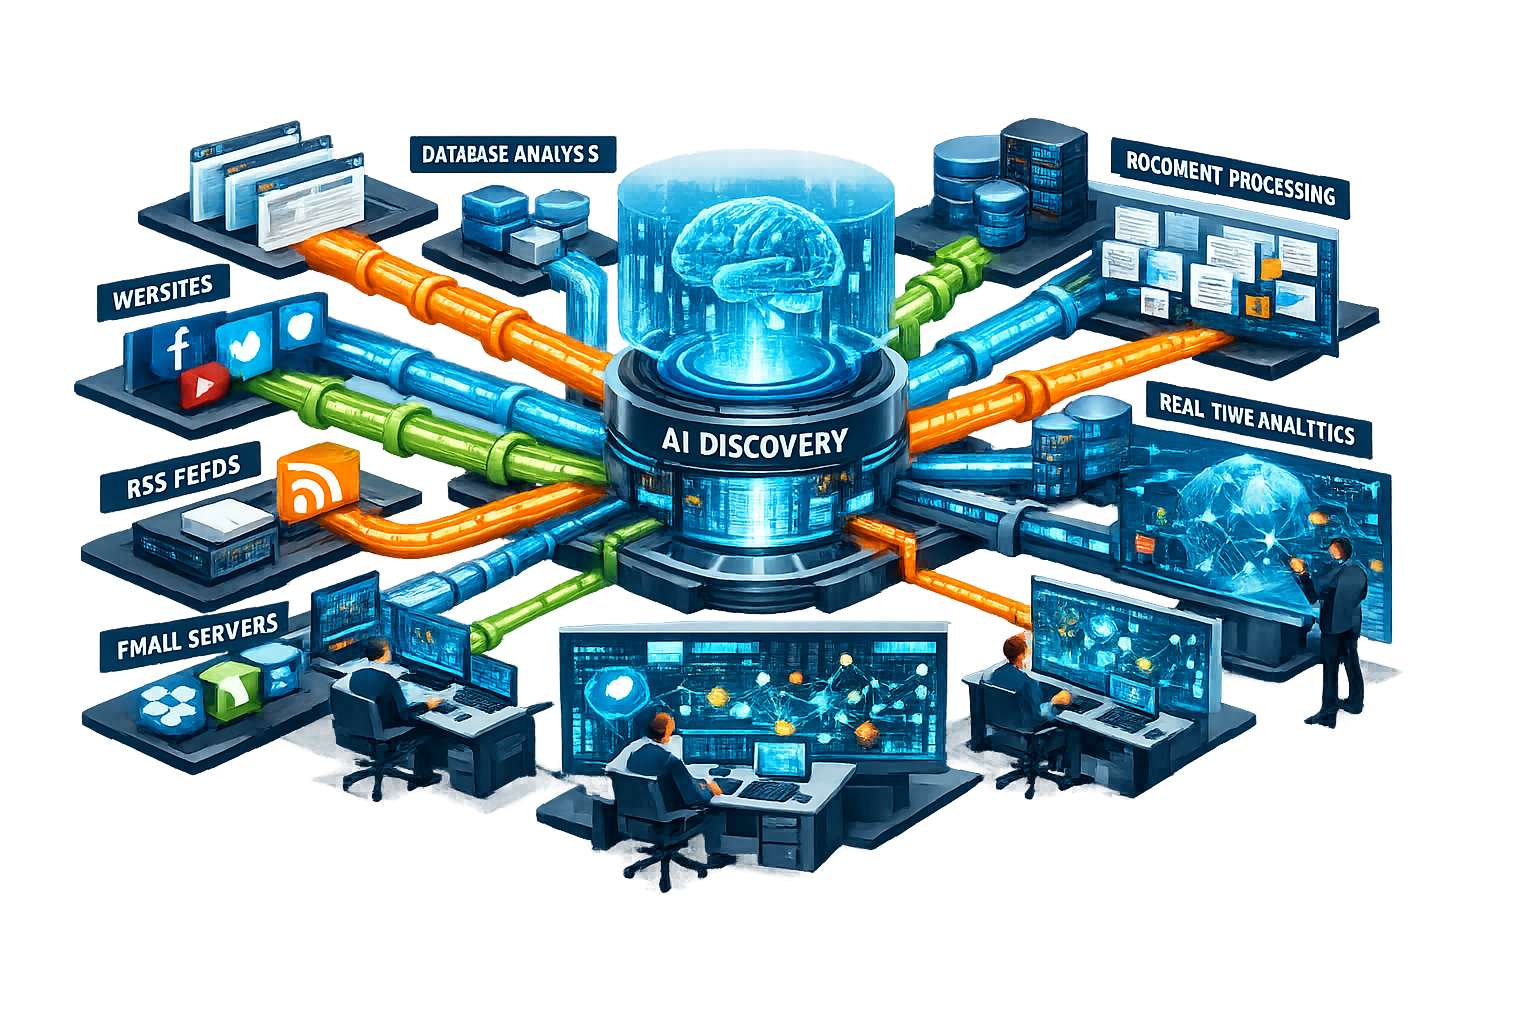
Information Collection
Any analysis or research starts by locating and ingesting
available information in the field under focus. The
information can be discovered from a number of sources, both
public and private. Available data collectors allow ease of
access for connecting to and consuming information continually
as it becomes available.
Some of the available collectors include the following:
-
The system can be setup to monitor any number of sites
and/or specific URLs that are programmatically accessed to
scrape information. While some sites provide static content,
others might be updated on a consistent basis. The system
intelligently locates new content and populates the
discovery database with it.
-
Organizations usually compile their own private research and
document corpuses. The Discovery service can connect to any
local or popular pre-existing storage service (such as
Dropbox, Box, Google Drive, S3 etc) and ingest selected
folders.
-
Existing connectors to social media sites utilize user
defined search patterns to filter and locate public opinion
messages of interest. These messages can be analyzed with
additional tools to glean useful information.
Additional supported sources include RSS feeds, zipped
document archives and email accounts. In addition, the system
provides the capability to link with external API based
services for specialized information retrieval.
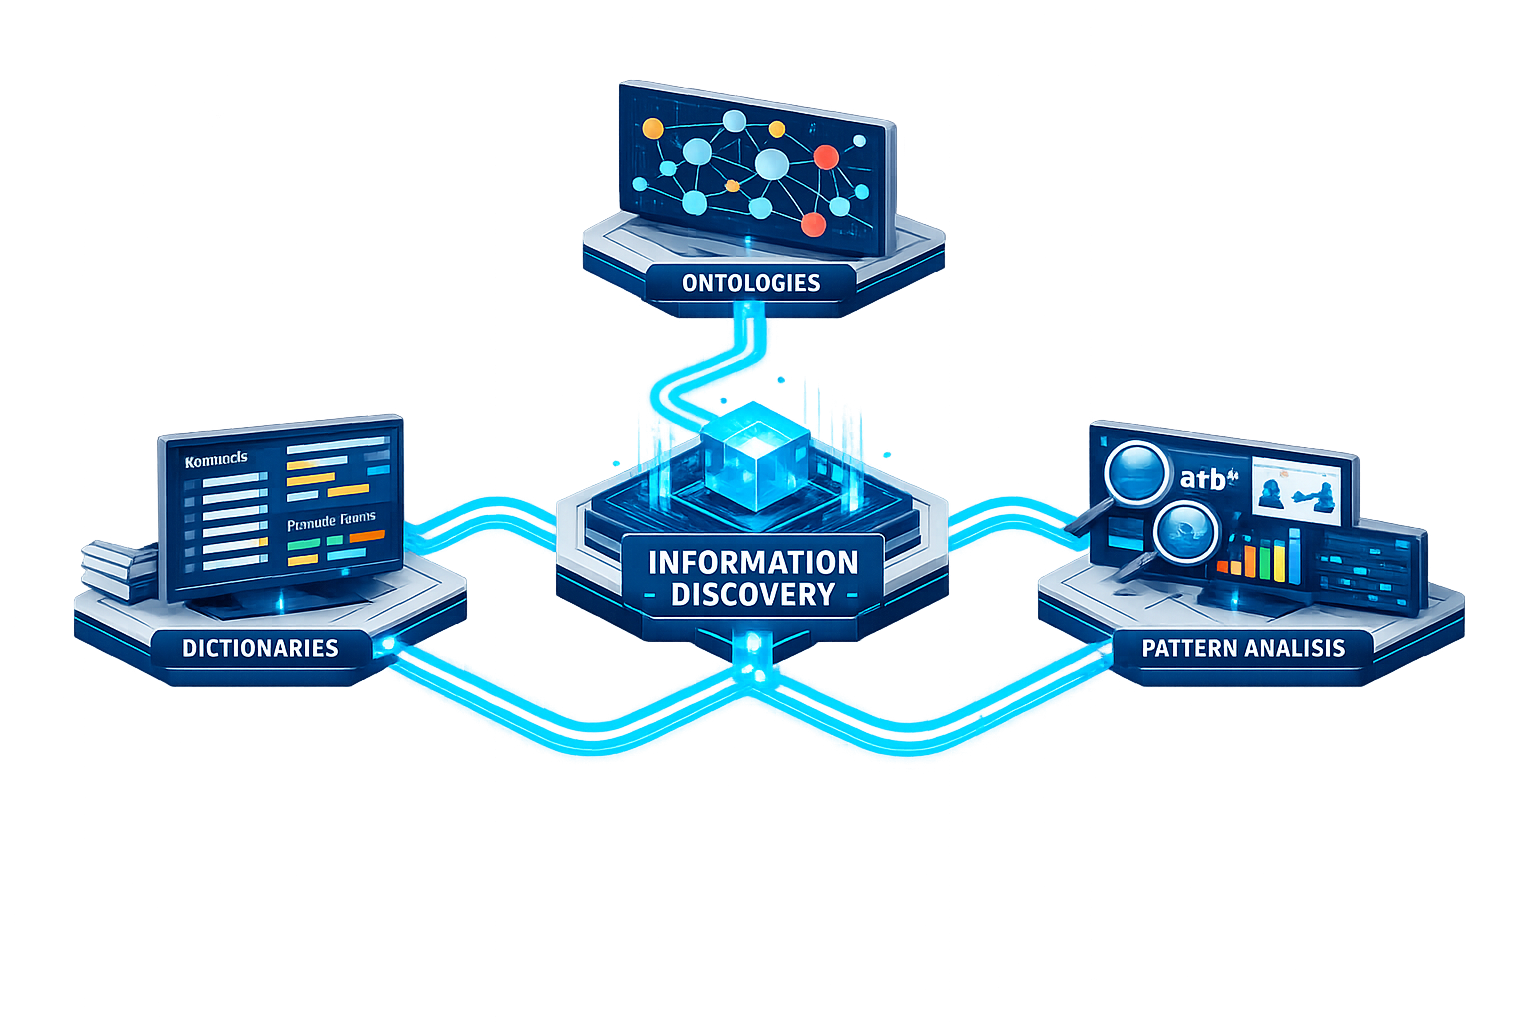
Data Markup
Information discovery is the essential first link in the
analysis chain. The Discovery process results in the
proverbial haystack of data and it is up to the users to
locate the desired “information needles.” Fortunately, the
right ensemble of tools helps expedites the process
significantly.
Dictionaries
All industries and verticals have their own specific sets of
terms, which carry special meaning within that field. Such
terms constitute the dictionaries for that domain and usually
carry a lot of significance. Furthermore, terms and phrases
with higher statistical usage can be the basis of identifying
patterns around how they are treated and received.
Ontologies
Ontologies represent the grammar for the domain. They impart
additional meaning to the dictionary elements by defining the
relationships between them. This allows for building analyzers
and reasoners that define the patterns of usage for these
terms. True Meridian provides pre-built dictionaries and
ontologies for a number of verticals as a starting point.
Pattern Analysis
Pattern Analysis is applicable at many different levels. Some
examples include Regular Expressions, Statistical patterns,
Images and Chart patterns, Behavior patterns and a lot more.
At the simplest level, text analysis may involve looking for
texts that conform to Regular Expressions, such as email
addresses or credit card numbers. More complex patterns can be
defined as required by the analysis at hand.
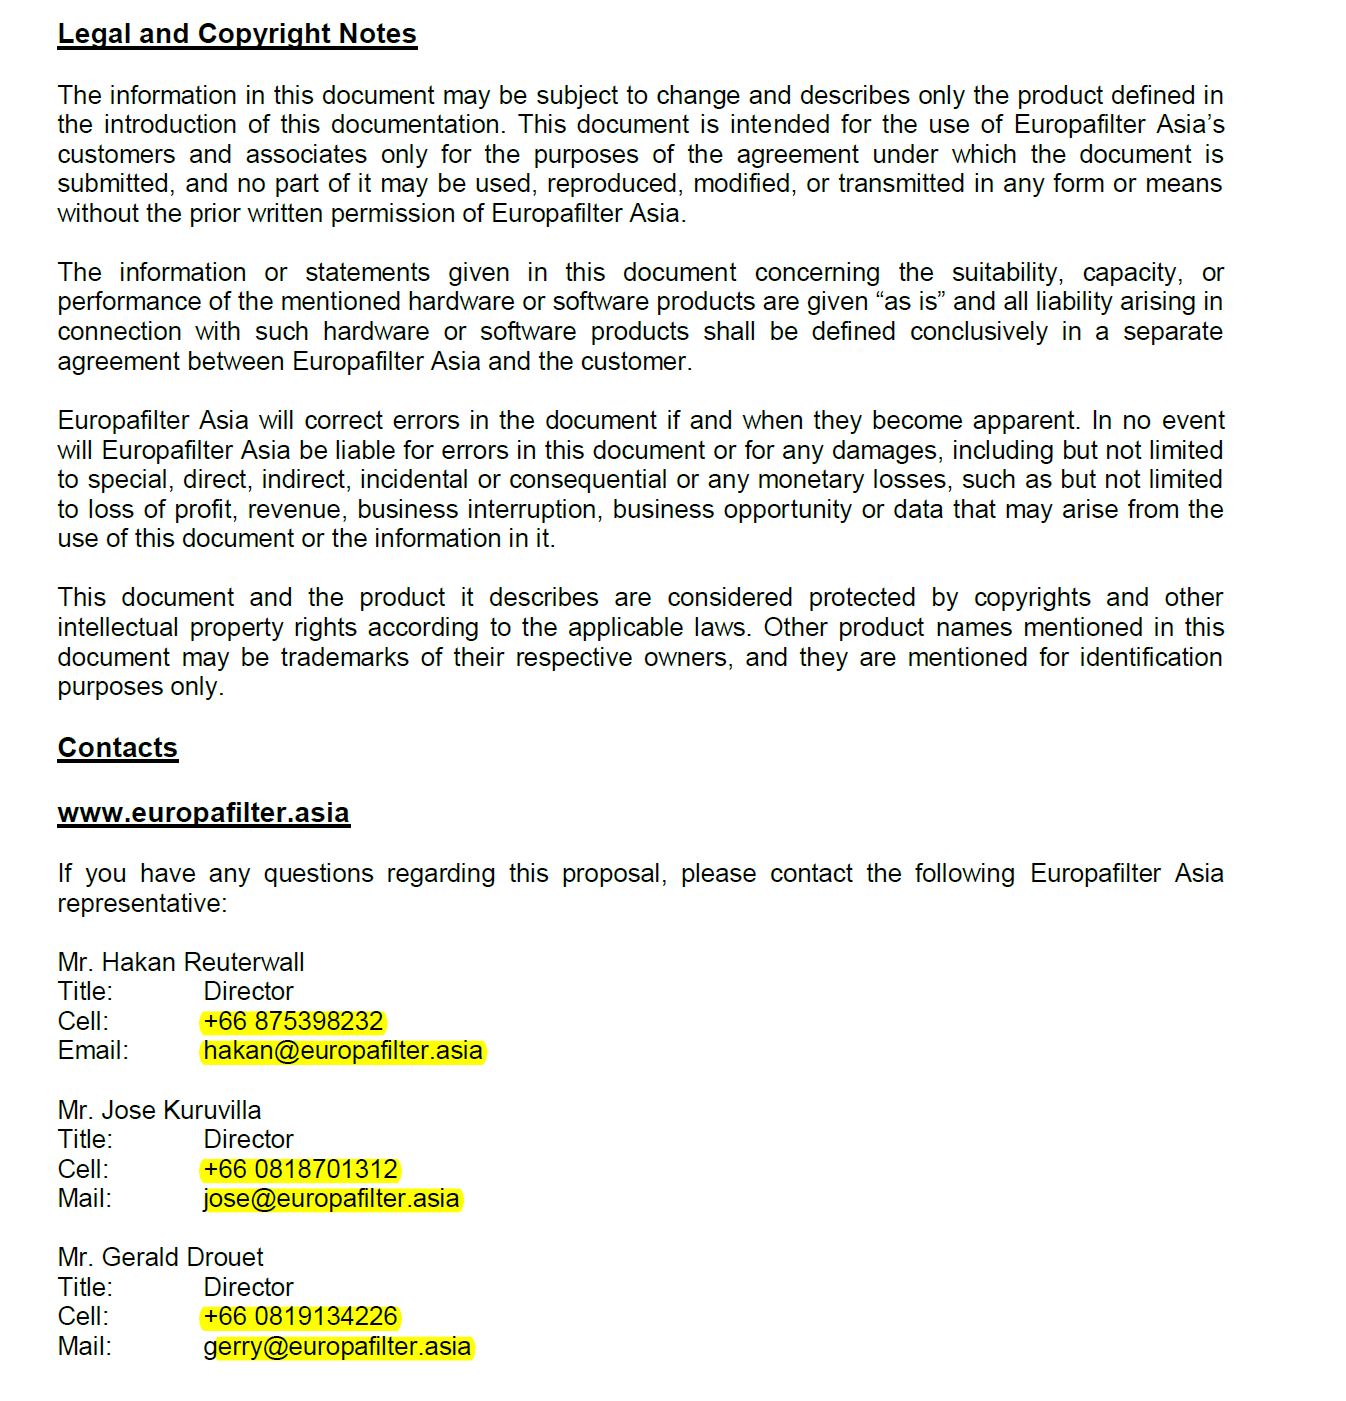
Highlighting and Reporting
Once the desired patterns are located, True Meridian
technology provides the tools to generate reports around
the specific locations of the texts and highlight the
original documents for a full contextual view. This allows
for easy location of the desired content within copious
documents. The example below shows a pattern analysis
application, where a PDF document was scanned to locate
phone numbers and email addresses. The document was also
rewritten to highlight the data of interest.
🔍
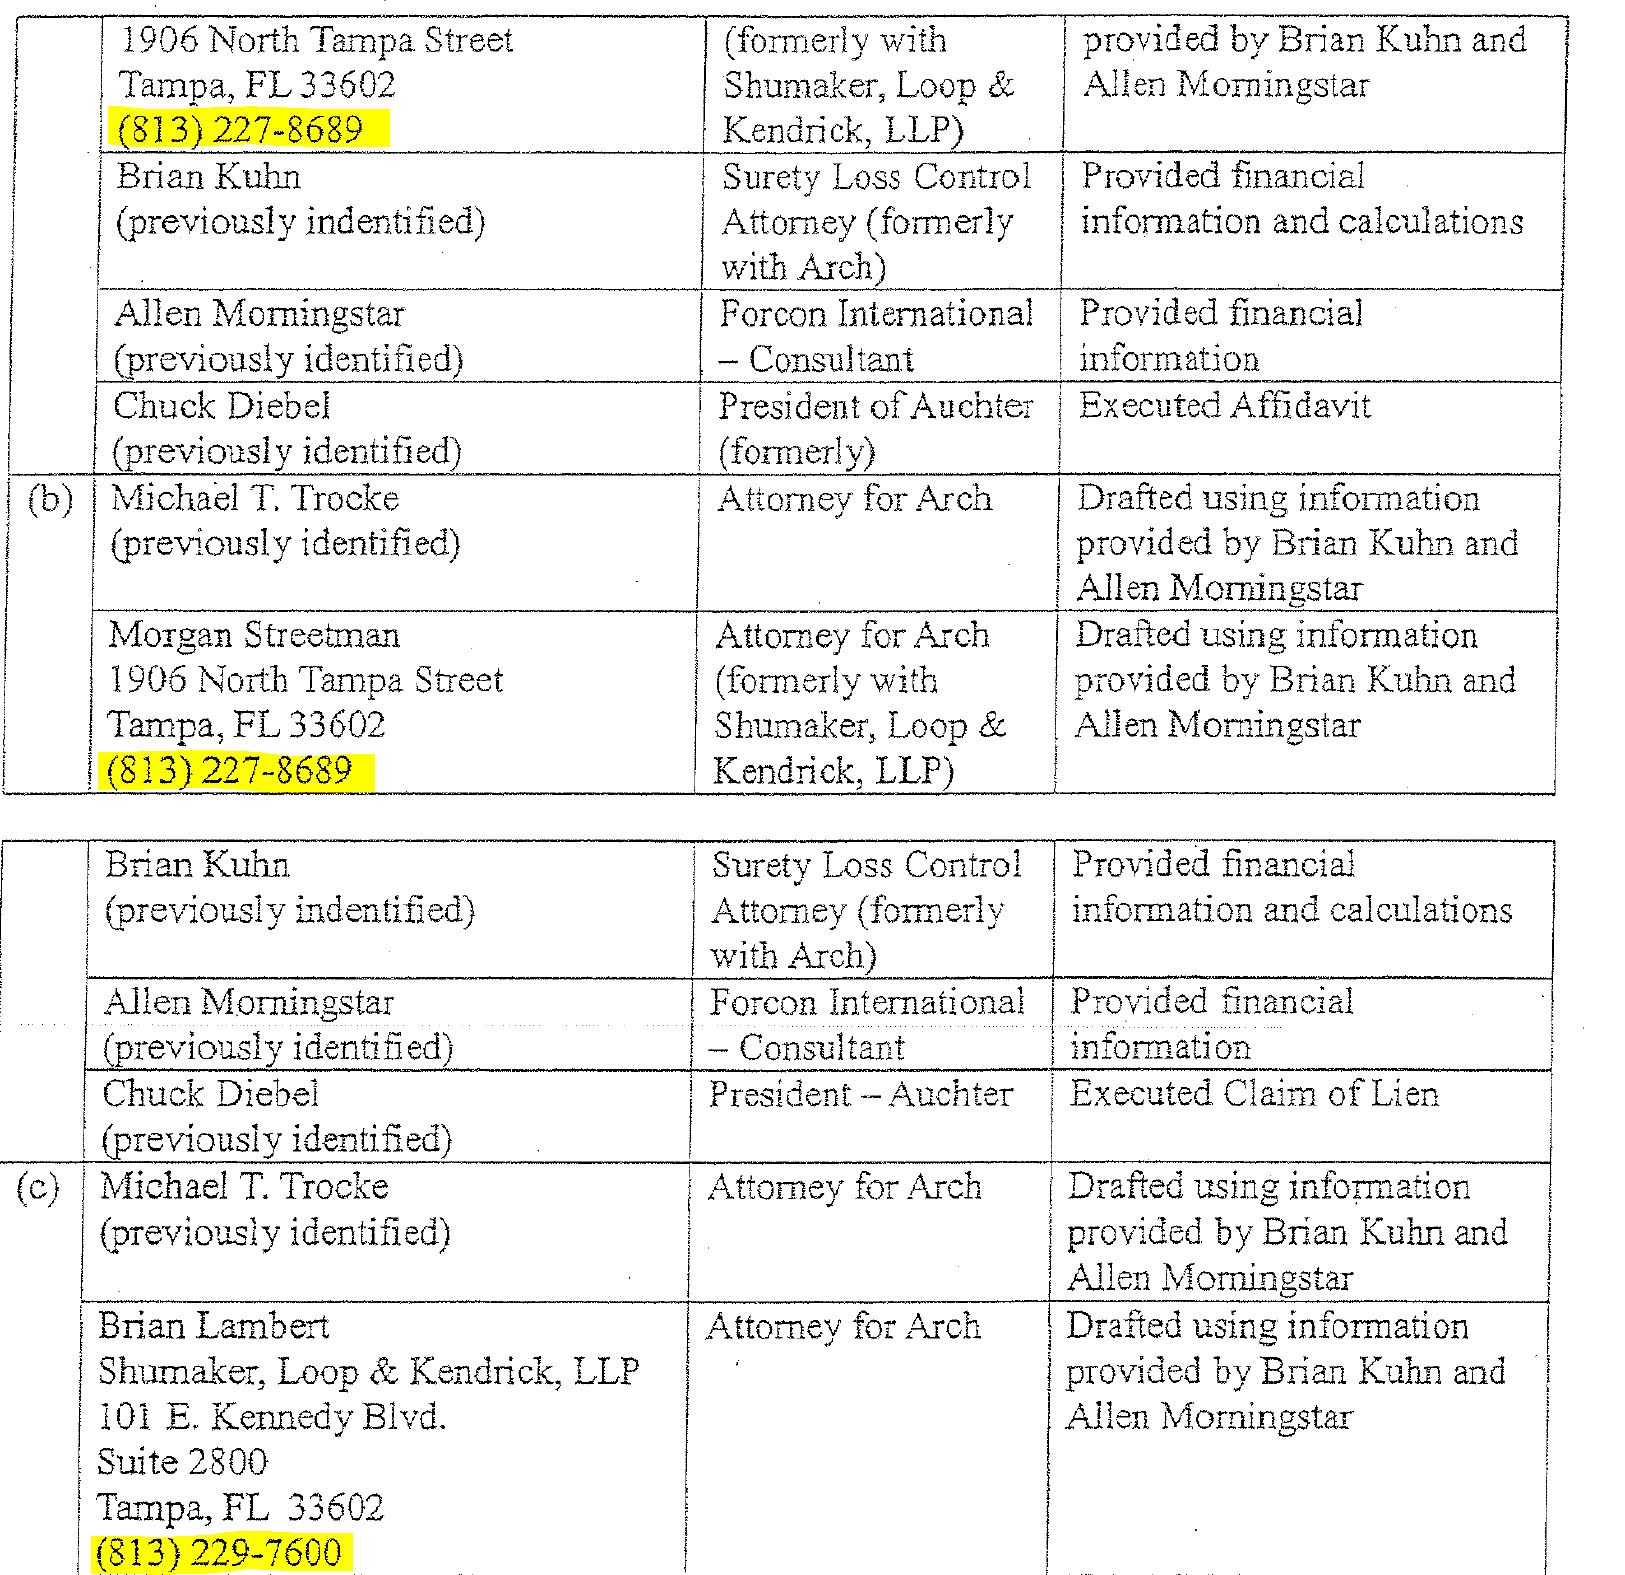
Image Markups
In addition to information location and marking it up
within text based documents, True Meridian also provides
the technology to locate information within scanned
document images and highlight scanned texts. Image
enhancements filters used in conjunction with the OCR
technology allow for this type of information discovery.
The image shown below was originally a scanned JPEG image,
that resulted in a second version with marked up
information.
🔍
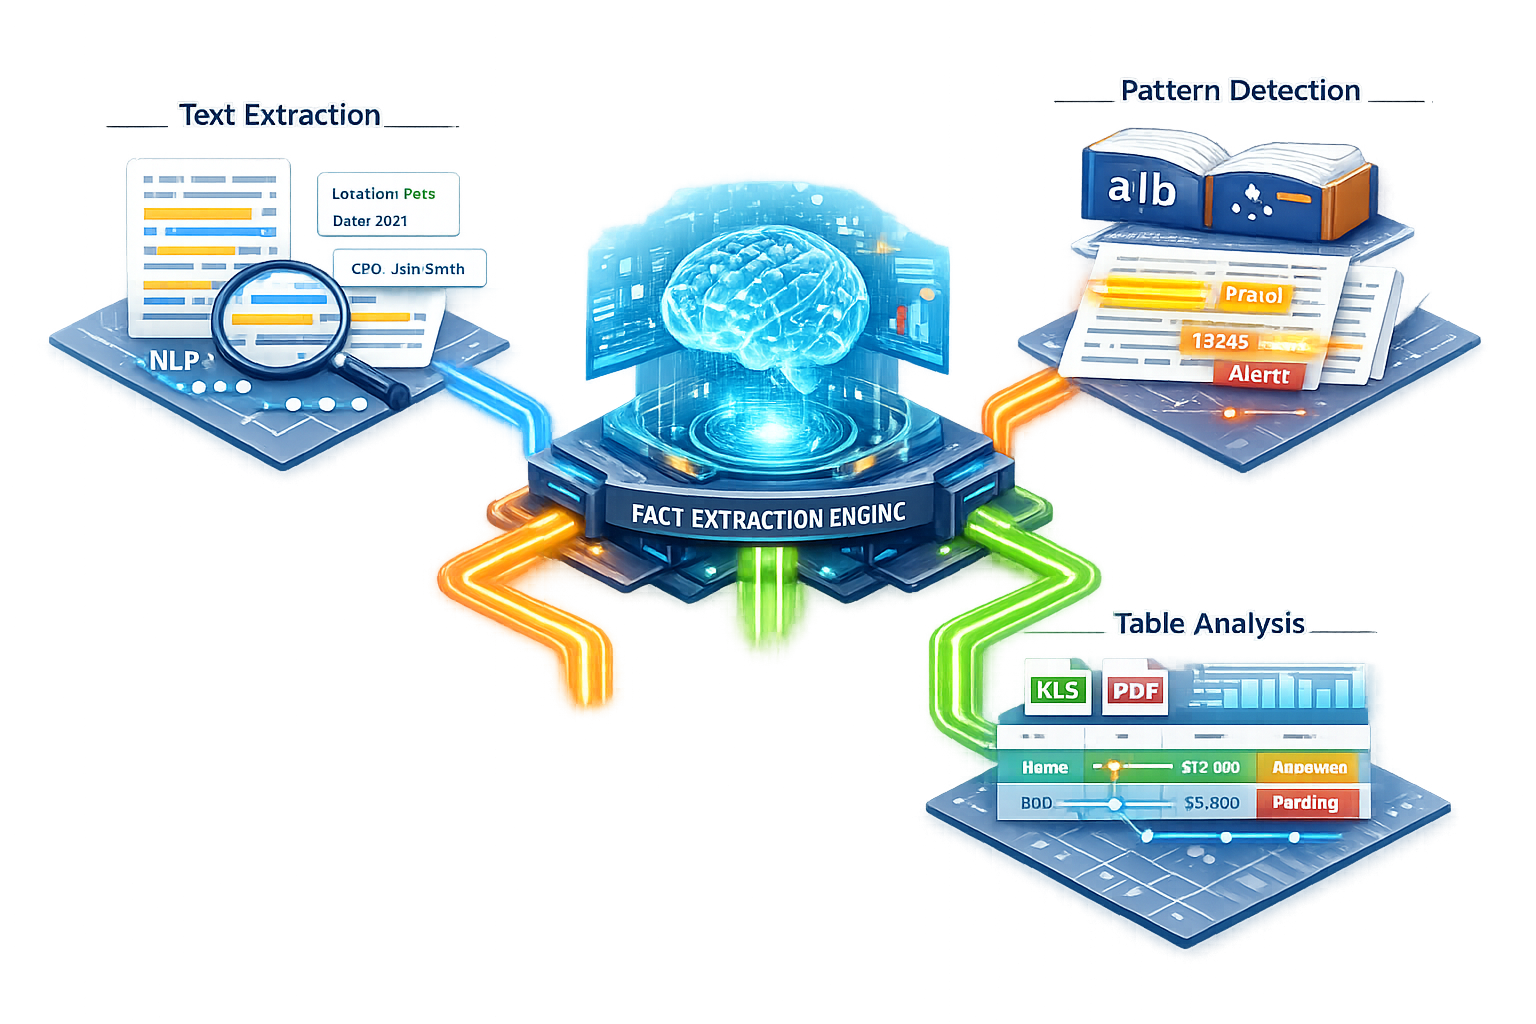
Fact Extraction
Location of patterns using regular expressions and dictionary
terms provides a more focused area of search. It is imperative
to locate the full context of information, however, to make it
more meaningful. This is made possible by extracting the full
facts around the located terms.
Text extraction
Location of a term of interest is far more useful if the
complete context of its appearance is readily available. Using
NLP techniques, it is possible to define paragraph and
sentence boundaries around the region of interest. Each of
these extracted sentences is referred to as a context based
fact. The fact and its location is recorded and made available
on demand as the user requires.
Table Analysis
Sometimes the pattern may exist within a single column of a
table, such as an Excel file or a PDF table. Putting
information in a table provides an order of structure by
default, if the column contents can be aligned with the column
headers. The said correlation is easily achieved for some file
formats but it is extremely difficult for others, especially
PDFs. Infospihon tools allow for this correlation for most
formats to provide table based fact extraction.
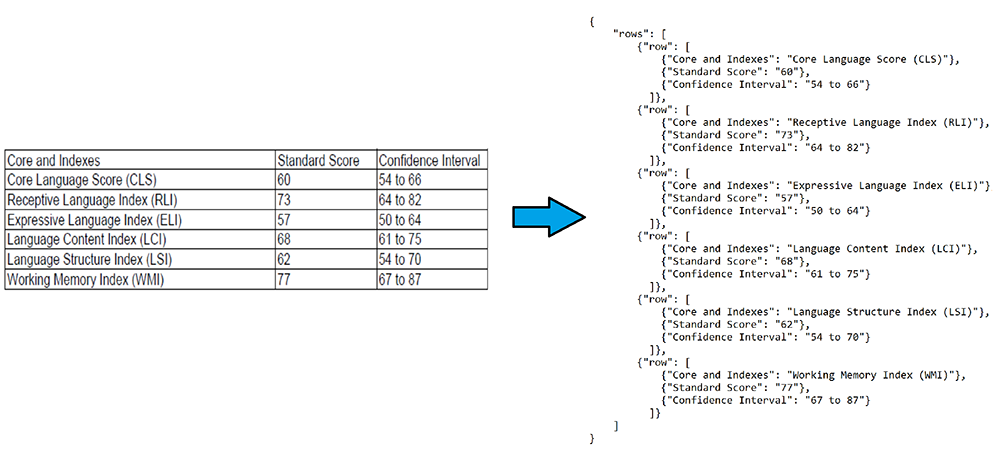
A simple structure extraction example is depicted below, where
a PDF based table is returned as a JSON object.
Image Analysis
An additional order of difficulty is introduced if the
original document content is not represented as text but as
text documents scanned to images. Such documents are processed
by using image enhancement filters and OCR based text
extraction as the initial steps. This enables the text based
fact extraction, as stated in an earlier case. The extracted
terms’ positions are located on the original images and
highlighted for easy viewing as well.
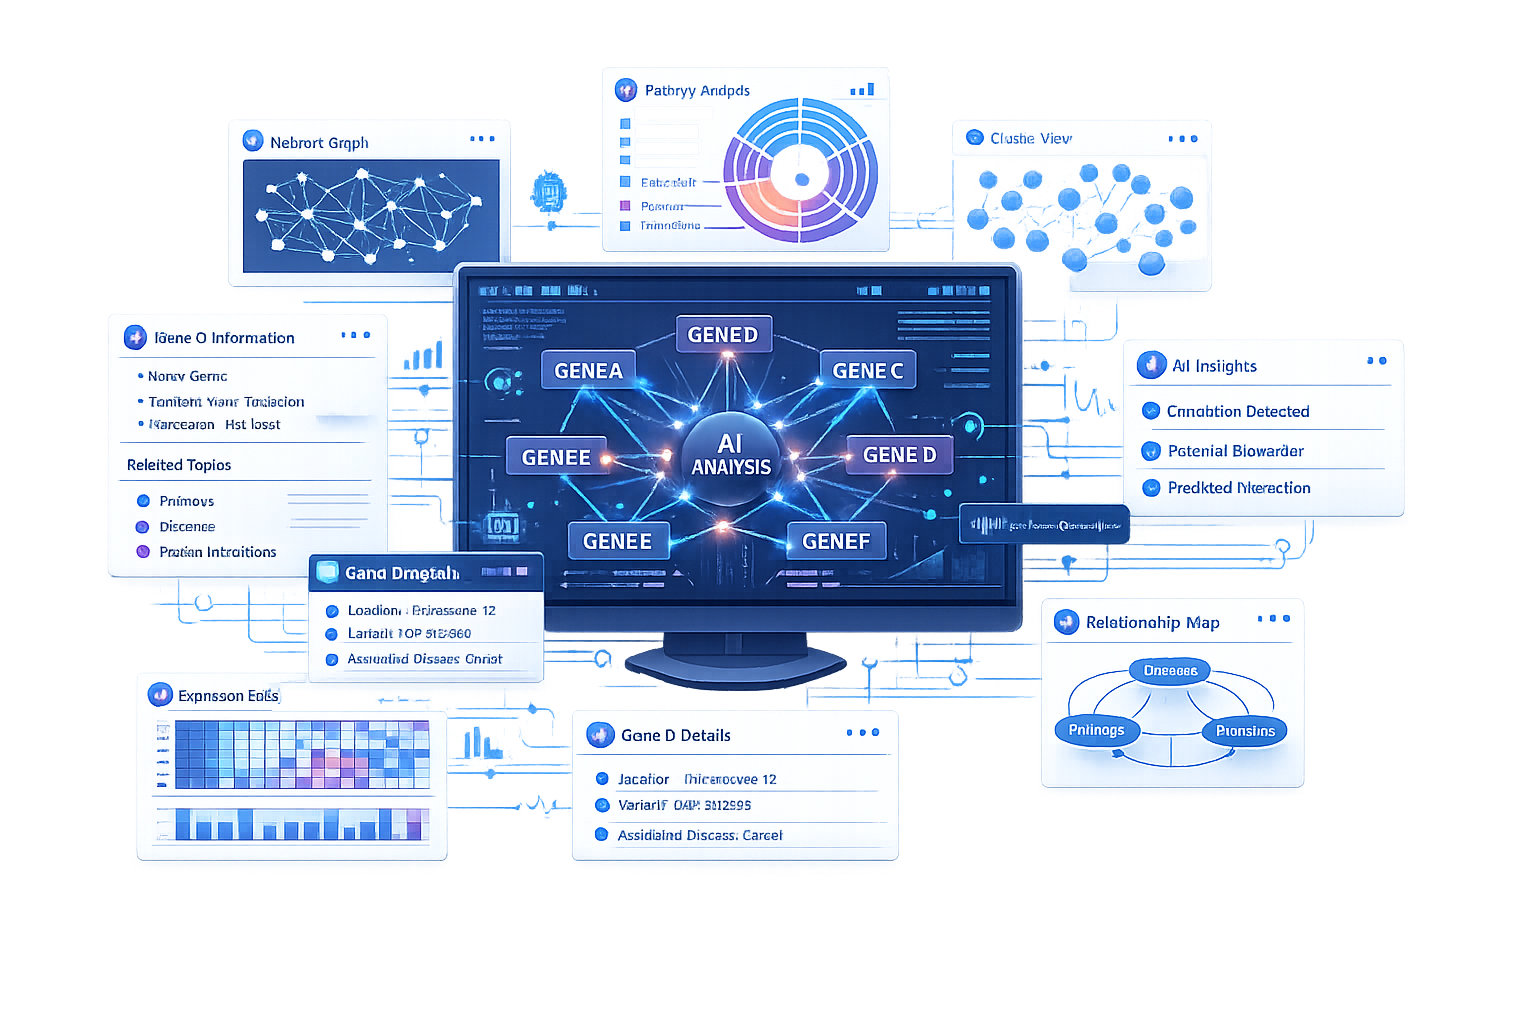
Visualization
In addition to the usual graphing tools, True Meridian
provides enhanced visualization techniques that allow
different perspectives on the same data set. This leads to new
insights that may not be evident using traditional tools. Some
visualization examples are shown below, which provide
different assessments for the same data set. This specific
data deals with six of the more common genes, information
topics usually associated with them, and their details. An
interactive version of these layouts can be viewed on the
Solutions page.
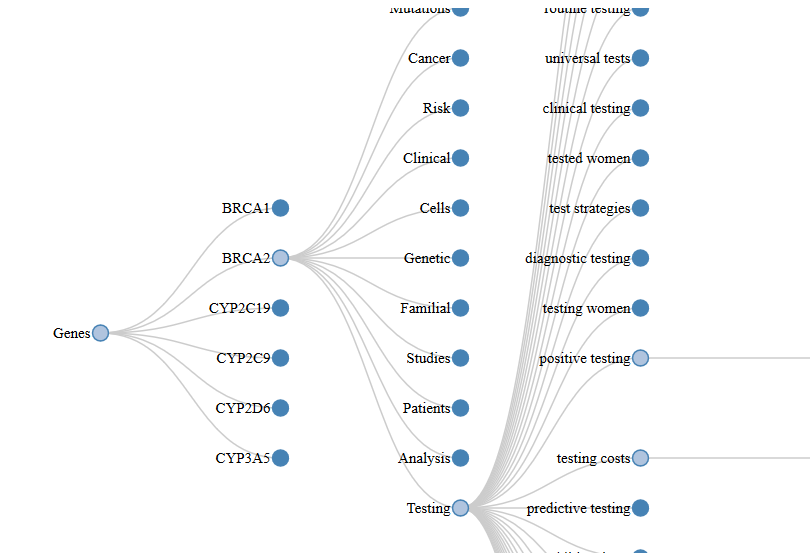
Collapsible Trees
The Collapsible tree layout shows a multilevel
hierarchical view and allows the user to manage a small
group of data at any time. The first layer provides the
genes under analysis. Each node of interest can be
expanded or collapsed as needed to keep the view clear and
deal with a manageable chunk of information at a time. The
second layer lists the popular topics associated with the
gene. The next level provides text clusters for the topic
of interest. Finally, each cluster can be further expanded
to view the detailed text itself.
🔍
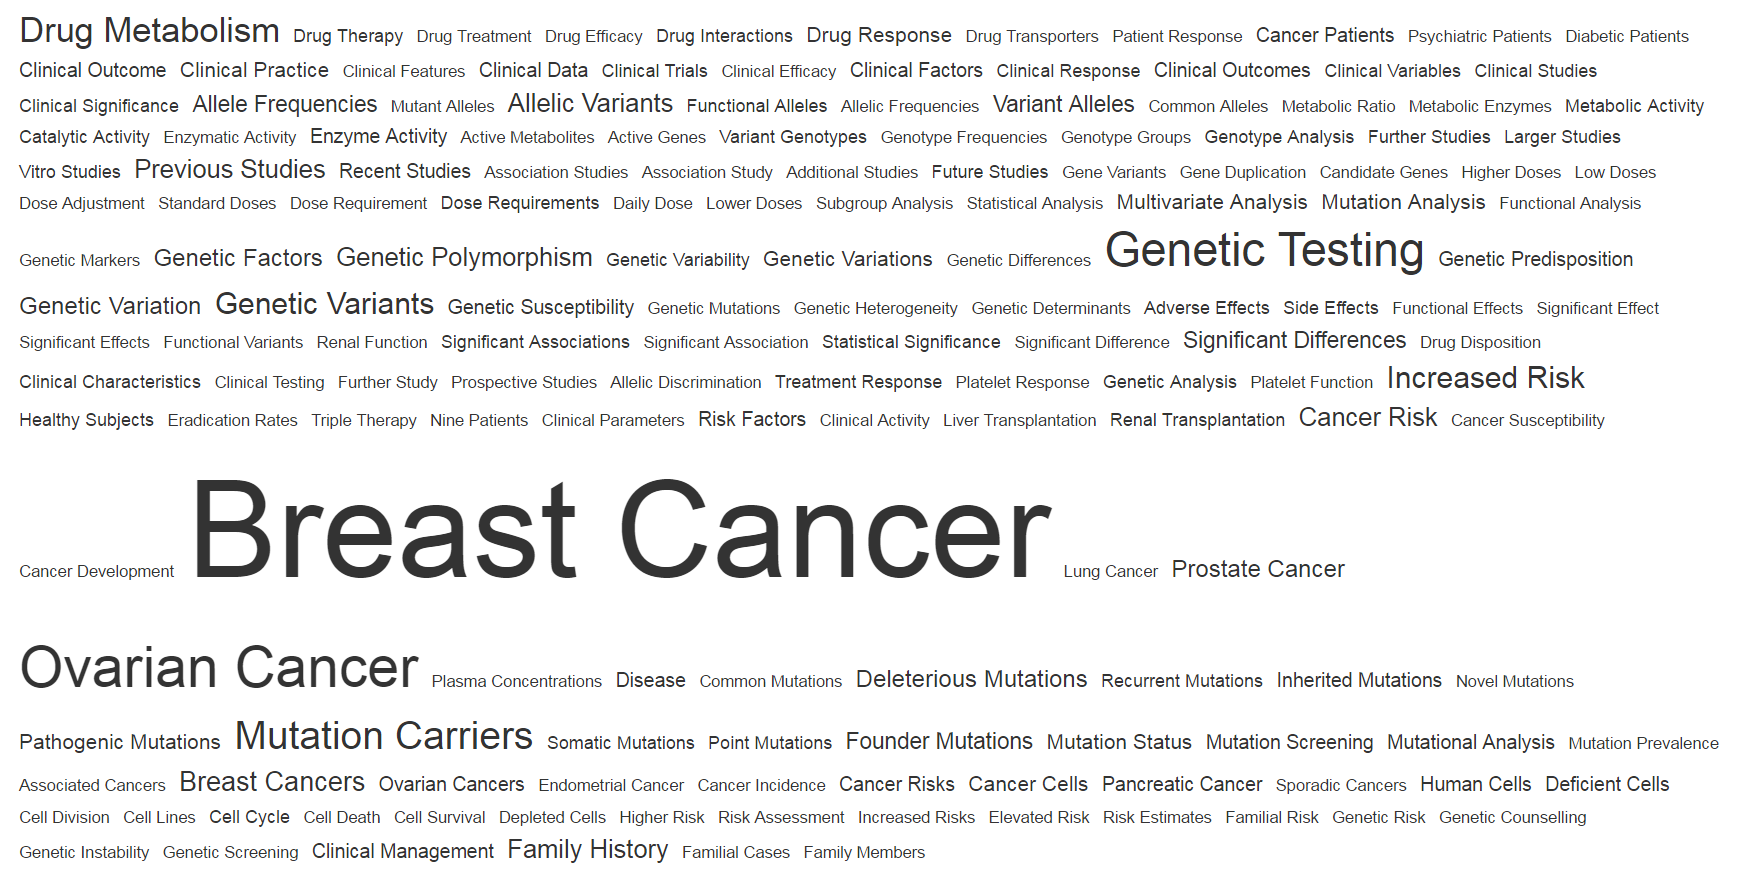
Word clouds
A word cloud takes the user directly to the text clusters
of interest and immediately provides an appreciation for
the significance of each. All topics are presented within
a single view, with the topic size scaled appropriately to
reflect its impact. This allows the inspection of the more
frequent phrases and themes before moving on to additional
texts.
🔍
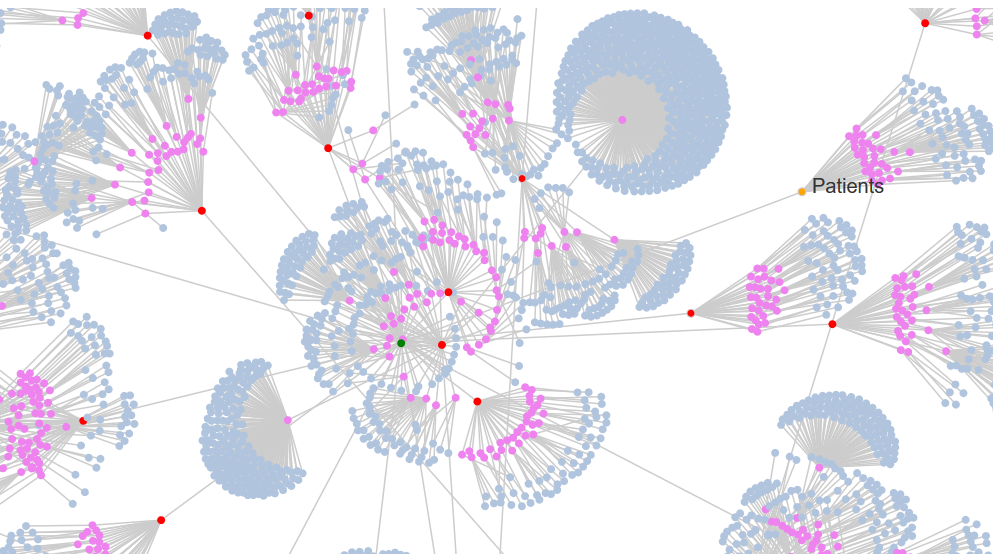
Force Directed Graphs
This visualization has some similarity to the Collapsible
tree layout. The view starts as a fully grown tree,
originating at the center and extending outwards. Each
layer of the expanding tree is colored coded to show its
position in the hierarchy and the density of attached
nodes shows how that topic might have flourished. The
nodes can be temporarily collapsed to provide more focus
to the other points of interest. Details attached to a
specific node can be examined by hovering over it to
examine what it represents.
🔍
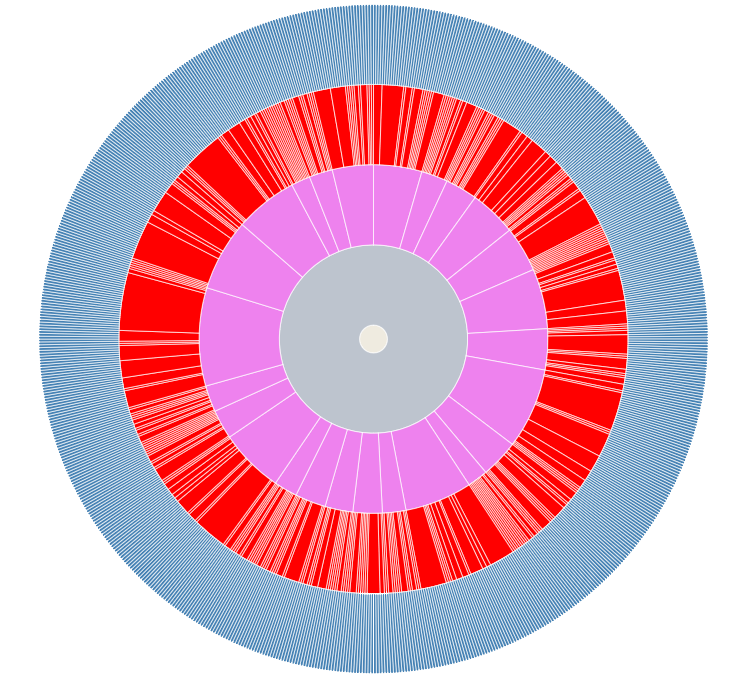
Sunburst Diagrams
A Sunburst has some similarities to a pie chart, if one
can visualize the pie to consist of several concentric
layers with each outer layer providing some additional
flavor. Every layer is sliced in proportion to the
information content it contains, while maintaining its
relationship with the inner circle that created it. Any
slice, regardless of its overall positioning, can be
provided full focus temporarily by selecting it to observe
its full details and just easily be defocused to get back
to the full view.
🔍
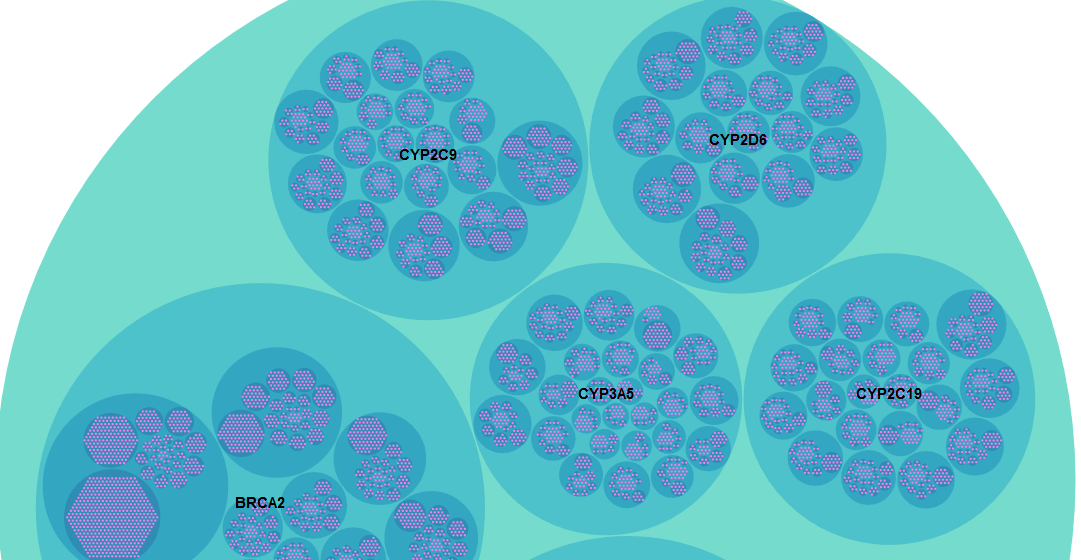
Packed Clusters
Packed Cluster layout starts with a high level view of the
data, showing how it is packaged in a single glance. Each tier
is represented by a packed bubble, with its size proportional
to the content it carries inside. Selecting a bubble allows
zooming into it for a closer look and exploring it more. The
process continues at each level until the finest of details is
visible at the innermost molecule of information.
🔍
🔍
Sentiment Analysis
Sentiment Analysis tools utilize Natural Language Processing
and statistical analysis to measure the sentiment of a given
piece of text or narrative.True Meridian Sentiment Analysis
service utilizes polarity based analysis, where the sentiment
is graded on a linear scale of -10 to +10. The system is
initially trained using vector classifiers to enhance its
learning capabilities. Furthermore, in addition to generalized
sentiment training, the system is also trained with
information applicable to specific verticals in order to work
well with the domain specific sentiment.

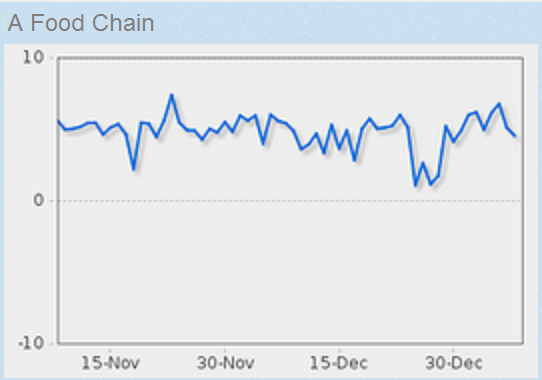
Small Business Analysis
The sentiment engine has been trained and applied to a
number of markets in order to collect public opinions
through social media and provide a continuous monitor for
them. Some examples include restaurant and food analysis,
retail store chains and fitness centers. Additional tools
are provided for isolating the more polarized statements,
so that business owners can interact with them directly in
order to provide a better customer service experience. The
consumer sentiment for a popular food chain is reflected
in the chart below.
🔍
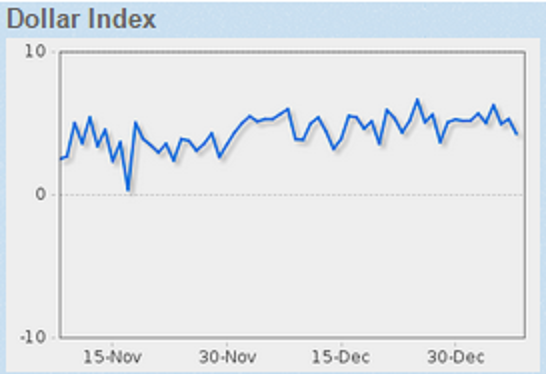
Financial Data Analysis
Financial markets use a number of different analysis
types, including fundamental analysis, technical analysis,
statistical analysis and sentiment analysis. The immediate
price action within a market can be driven by the general
trader sentiment leading to market panic or elation. News
announcements, expert commentary, even social media
comments can provide an insight into the overall public
feeling towards a commodity, security or currency.
True Meridian has trained the sentiment analysis system to
examine financial data and glean user sentiment. The
provided information is tracked in real time and the
sentiment graphically plotted to yield insight into the
market behavior. An example of such behavior is reflected
in the screenshot below for the Dollar Index.
🔍